Æ : Aesthetic Effect
Investigating the User Experience of Data Visualization
by Nick Cawthon
This is the price your customers see. Edit list price
About the Book
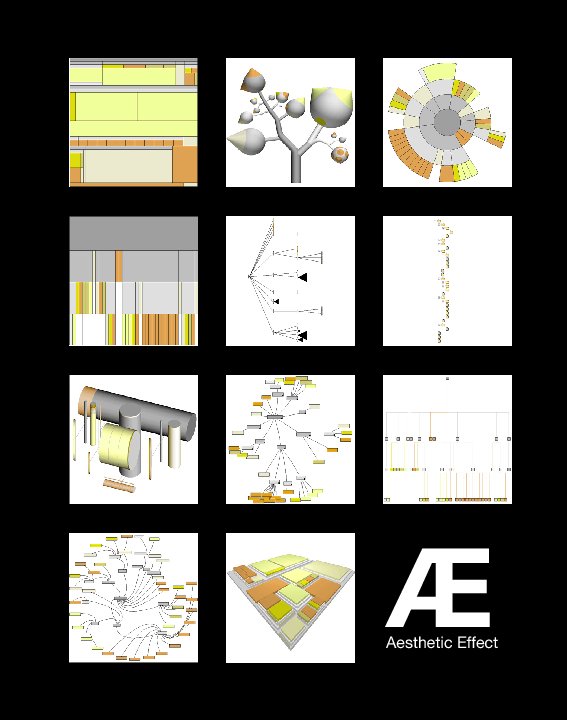
Through results gathered from a large-scale online survey of 285 participants from around the world, this research empirically investigated the assessment of aesthetic in 11 common data visualization display techniques. Visualizations represented in this research were generated from an identical hierarchical data set and visually normalized to avoid unwanted implications of default application parameters or personal preferences. Tested visualization display techniques were of a wide variety, spanning from categories such as node-linking, hyperbolic displays, space-filling to abstract representations. The origins of these display techniques were as varied as their method - tested visualizations were from academic institutions, personal hobbyists and open-source applications. Participants in this survey were asked to complete two sections - data retrieval and aesthetic response. In the data retrieval section, the 11 tested display techniques were used for timed question-and-answer tasks in which participants utilized the visualizations to answer questions regarding the hierarchical data set. For the aesthetic response section, participants provided quantitative aesthetic feedback while looking at the display technique as they would a painting, the presentation of the visualization viewed in isolation. Participants then provided qualitative feedback on their rationale for their subjective perception of the display technique. This rationalization of aesthetic response was queried for each visualization as a stand-alone entity, as well as in a group comparison. Components of this survey were randomized, along with the sequence of tested visualizations and their applied questions.
Results from subjective participant response shows data visualizations that portray non-orthogonal, organic qualities, receive higher aesthetic ranking. No categorical distinction was apparent in aesthetic ranking, as top-rated displays exist independently of category. Provided rationale further correlates these qualities with metrics of user experience, illustrating that aesthetic display techniques experience a delay in task abandonment. Proper evaluation of aesthetic and attractiveness is imperative to increase the base of first-time users to data visualization, as well as increase a higher level of repeat usage through a positive user experience. We have measured this in a randomized setting and confirmed this standpoint from two different methods within this study. If this survey is repeated, we hold confidence that the spread of results will be consistent.
Results from subjective participant response shows data visualizations that portray non-orthogonal, organic qualities, receive higher aesthetic ranking. No categorical distinction was apparent in aesthetic ranking, as top-rated displays exist independently of category. Provided rationale further correlates these qualities with metrics of user experience, illustrating that aesthetic display techniques experience a delay in task abandonment. Proper evaluation of aesthetic and attractiveness is imperative to increase the base of first-time users to data visualization, as well as increase a higher level of repeat usage through a positive user experience. We have measured this in a randomized setting and confirmed this standpoint from two different methods within this study. If this survey is repeated, we hold confidence that the spread of results will be consistent.
Features & Details
- Primary Category: Computers & Internet
-
Project Option: Standard Portrait, 7.75×9.75 in, 20×25 cm
# of Pages: 126 - Publish Date: Sep 29, 2009
- Keywords interaction design, user experience, aesthetic
See More


